All About Cumulative Flow Diagram (CFD)
Posted by SCRUMstudy® on August 20, 2022
Categories: Agile Agile Frameworks SBOK® Guide Scrum Scrum Guide Training
A Cumulative Flow Diagram (CFD) is a useful tool for reporting and tracking project performance. It provides a simple, visual representation of project progress at a particular point in time. It is usually used to provide a higher level status of the overall project and not daily updates for individual Sprints.
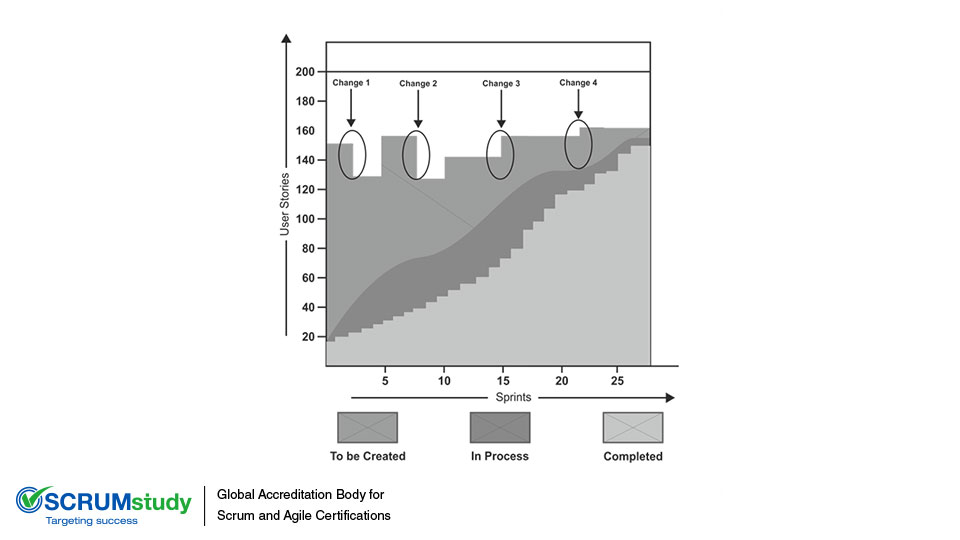
The figure above is an example of a CFD for a large project. It shows how many User Stories are yet to be created, in process of being created, and have been created. As customer requirements change, there is a change in the Cumulative User Stories which have to be delivered. Change points 1 and 2 are where the Product Owner removed existing user Stories in the Risk Adjusted Prioritized Product Backlog and Change points 3 and 4 are where the Product Owner added new User Stories in the Risk Adjusted Prioritized Product Backlog
This type of diagram can be a great tool for identifying roadblocks and bottlenecks within processes. For example, if the diagram shows one band becoming narrower while the previous band is becoming wider over time, there may be a bottleneck and changes may be needed to increase efficiency and/or improve project performance.