How is a Scrum Burndown Chart used to track progress and manage a Sprint effectively?
Posted bySCRUMstudy® on July 23, 2024
Categories Agile Agile Frameworks Product Owner Scrum Master Scrum Team
The Scrum Burndown Chart is a visual representation of the amount of work remaining in a sprint over time. It provides a snapshot of the team's progress towards completing the work committed to in the sprint backlog.
The Scrum Agile Burndown Chart is a visual representation used in Agile project management to track the progress of work completed within a sprint. It displays the amount of work remaining to be done over time, typically in the form of a line chart.
The horizontal axis represents time, usually in days or weeks, while the vertical axis represents the amount of work remaining, often measured in story points or tasks. As the team completes tasks or user stories, the line on the chart moves downward, indicating progress.
The goal of the Burndown Chart is to help the team visualize their progress towards completing the sprint's goals and to identify any deviations from the planned trajectory. It provides valuable insights into the team's velocity and allows for adjustments to be made if necessary to ensure the sprint's success.
A Scrum burndown chart is a visual tool used in agile project management to track the progress of work completed within a sprint. It displays the remaining effort (usually measured in story points or hours) over time, typically on a daily basis. The vertical axis represents the amount of work remaining, while the horizontal axis represents time, usually in days or sprints.
In Scrum, the risk management activities are divided among various roles with some responsibility resting with everyone in the Scrum Team and the Scrum Master facilitating the process. Risk management is integral to ensuring value creation; therefore, risk management activities are performed throughout the project lifecycle and not just during project initiation.
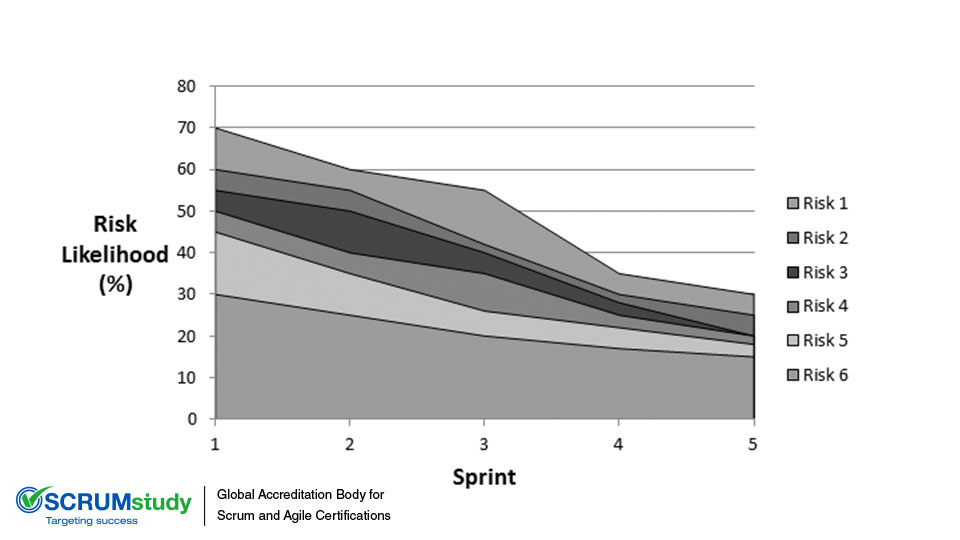
Each risk could be assessed using different Risk Assessment tools. However, the preferred tool for assessing risks to create a Risk Burndown Chart is Expected Monetary Value (EMV).
The information gathered during risk assessment may be used to create a Risk Burndown Chart. This depicts cumulative project risk severity over time. The likelihoods of the various Risks are plotted on top of each other to show cumulative risk on the y-axis. The initial identification and evaluation of risks on the project and the creation of the Risk Burndown Chart are done initially. Then, at predetermined time intervals, new risks may be identified and assessed and remaining risks should be re-evaluated and updated accordingly on the chart. An appropriate time to do this is during the Sprint Planning Meeting. Tracking risks in this manner allows the team to recognize trends in risk exposure and take appropriate action, as necessary.