How is a Scrum Burndown Chart used to track progress and manage a Sprint effectively?
Posted bySCRUMstudy® on July 23, 2024
Categories Agile Agile Frameworks Product Owner Scrum Master Scrum Team
The Scrum Burndown Chart is a visual representation of the amount of work remaining in a sprint over time. It provides a snapshot of the team's progress towards completing the work committed to in the sprint backlog.
The Scrum Agile Burndown Chart is a visual representation used in Agile project management to track the progress of work completed within a sprint. It displays the amount of work remaining to be done over time, typically in the form of a line chart.
The horizontal axis represents time, usually in days or weeks, while the vertical axis represents the amount of work remaining, often measured in story points or tasks. As the team completes tasks or user stories, the line on the chart moves downward, indicating progress.
The goal of the Burndown Chart is to help the team visualize their progress towards completing the sprint's goals and to identify any deviations from the planned trajectory. It provides valuable insights into the team's velocity and allows for adjustments to be made if necessary to ensure the sprint's success.
A Scrum burndown chart is a visual tool used in agile project management to track the progress of work completed within a sprint. It displays the remaining effort (usually measured in story points or hours) over time, typically on a daily basis. The vertical axis represents the amount of work remaining, while the horizontal axis represents time, usually in days or sprints.
In Scrum, the risk management activities are divided among various roles with some responsibility resting with everyone in the Scrum Team and the Scrum Master facilitating the process. Risk management is integral to ensuring value creation; therefore, risk management activities are performed throughout the project lifecycle and not just during project initiation.
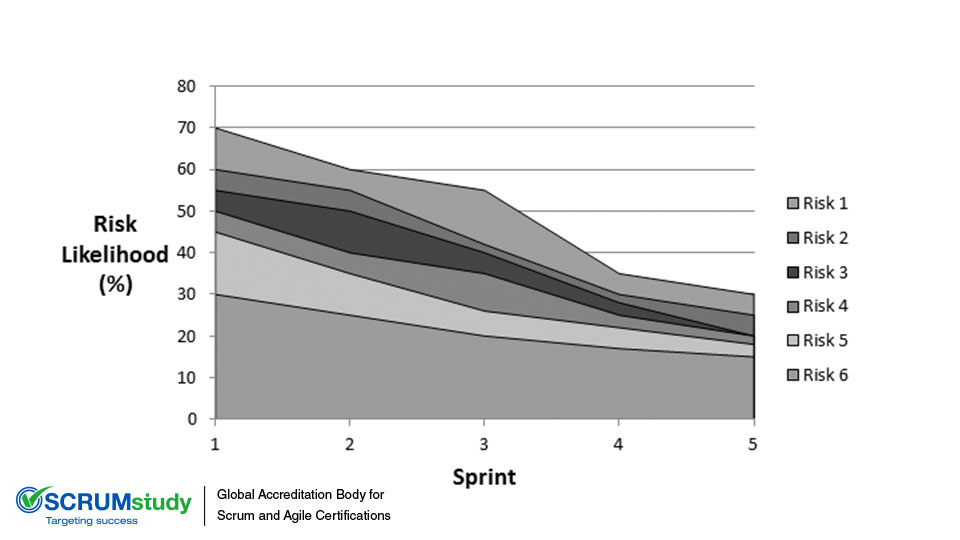
Each risk could be assessed using different Risk Assessment tools. However, the preferred tool for assessing risks to create a Risk Burndown Chart is Expected Monetary Value (EMV).
The information gathered during risk assessment may be used to create a Risk Burndown Chart. This depicts cumulative project risk severity over time. The likelihoods of the various Risks are plotted on top of each other to show cumulative risk on the y-axis. The initial identification and evaluation of risks on the project and the creation of the Risk Burndown Chart are done initially. Then, at predetermined time intervals, new risks may be identified and assessed and remaining risks should be re-evaluated and updated accordingly on the chart. An appropriate time to do this is during the Sprint Planning Meeting. Tracking risks in this manner allows the team to recognize trends in risk exposure and take appropriate action, as necessary.
Agile Scrum burndown chart
Posted bySCRUMstudy® on June 28, 2024
Categories Agile Agile Frameworks Product Owner Scrum Master Scrum Team
The Agile Scrum burndown chart is a visual representation that tracks the progress of work completed within a Sprint. It plots the remaining effort (usually in story points or hours) against time throughout the Sprint duration. As the team completes tasks and user stories, the burndown chart shows a downward trend, ideally reaching zero by the end of the Sprint. This chart helps teams monitor their velocity, identify potential bottlenecks or delays early, and make informed adjustments to ensure Sprint goals are met. By providing a clear and transparent view of work progress, the burndown chart facilitates effective Sprint planning, enhances accountability, and supports continuous improvement within Agile Scrum teams.
The Scrum Agile Burndown Chart is a visual representation used in Agile project management to track the progress of work completed within a sprint. It displays the amount of work remaining to be done over time, typically in the form of a line chart.
The horizontal axis represents time, usually in days or weeks, while the vertical axis represents the amount of work remaining, often measured in story points or tasks. As the team completes tasks or user stories, the line on the chart moves downward, indicating progress.
The goal of the Burndown Chart is to help the team visualize their progress towards completing the sprint's goals and to identify any deviations from the planned trajectory. It provides valuable insights into the team's velocity and allows for adjustments to be made if necessary to ensure the sprint's success.
A Scrum burndown chart is a visual tool used in agile project management to track the progress of work completed within a sprint. It displays the remaining effort (usually measured in story points or hours) over time, typically on a daily basis. The vertical axis represents the amount of work remaining, while the horizontal axis represents time, usually in days or sprints.
In Scrum, the risk management activities are divided among various roles with some responsibility resting with everyone in the Scrum Team and the Scrum Master facilitating the process. Risk management is integral to ensuring value creation; therefore, risk management activities are performed throughout the project lifecycle and not just during project initiation.
Each risk could be assessed using different Risk Assessment tools. However, the preferred tool for assessing risks to create a Risk Burndown Chart is Expected Monetary Value (EMV).
The information gathered during risk assessment may be used to create a Risk Burndown Chart. This depicts cumulative project risk severity over time. The likelihoods of the various Risks are plotted on top of each other to show cumulative risk on the y-axis. The initial identification and evaluation of risks on the project and the creation of the Risk Burndown Chart are done initially. Then, at predetermined time intervals, new risks may be identified and assessed and remaining risks should be re-evaluated and updated accordingly on the chart. An appropriate time to do this is during the Sprint Planning Meeting. Tracking risks in this manner allows the team to recognize trends in risk exposure and take appropriate action, as necessary.
Scrum Burndown Chart
Posted bySCRUMstudy® on June 26, 2024
Categories Agile Agile Frameworks Product Owner Scrum Master Scrum Team
The Scrum Burndown Chart is a visual representation of the amount of work remaining in a sprint over time. It provides a snapshot of the team's progress towards completing the work committed to in the sprint backlog.
The Scrum Agile Burndown Chart is a visual representation used in Agile project management to track the progress of work completed within a sprint. It displays the amount of work remaining to be done over time, typically in the form of a line chart.
The horizontal axis represents time, usually in days or weeks, while the vertical axis represents the amount of work remaining, often measured in story points or tasks. As the team completes tasks or user stories, the line on the chart moves downward, indicating progress.
The goal of the Burndown Chart is to help the team visualize their progress towards completing the sprint's goals and to identify any deviations from the planned trajectory. It provides valuable insights into the team's velocity and allows for adjustments to be made if necessary to ensure the sprint's success.
A Scrum burndown chart is a visual tool used in agile project management to track the progress of work completed within a sprint. It displays the remaining effort (usually measured in story points or hours) over time, typically on a daily basis. The vertical axis represents the amount of work remaining, while the horizontal axis represents time, usually in days or sprints.
In Scrum, the risk management activities are divided among various roles with some responsibility resting with everyone in the Scrum Team and the Scrum Master facilitating the process. Risk management is integral to ensuring value creation; therefore, risk management activities are performed throughout the project lifecycle and not just during project initiation.
Each risk could be assessed using different Risk Assessment tools. However, the preferred tool for assessing risks to create a Risk Burndown Chart is Expected Monetary Value (EMV).
The information gathered during risk assessment may be used to create a Risk Burndown Chart. This depicts cumulative project risk severity over time. The likelihoods of the various Risks are plotted on top of each other to show cumulative risk on the y-axis. The initial identification and evaluation of risks on the project and the creation of the Risk Burndown Chart are done initially. Then, at predetermined time intervals, new risks may be identified and assessed and remaining risks should be re-evaluated and updated accordingly on the chart. An appropriate time to do this is during the Sprint Planning Meeting. Tracking risks in this manner allows the team to recognize trends in risk exposure and take appropriate action, as necessary.
Como um Scrum Burndown Chart é usado para monitorar o progresso e gerenciar um Sprint de forma eficaz?
Posted bySCRUMstudy® on January 23, 2024
Categories Agile Agile Frameworks Product Owner Scrum Master Scrum Team
.JPG)
O Scrum Burndown Chart é uma representação visual da quantidade de trabalho restante em um sprint ao longo do tempo. Ele fornece um instantâneo do progresso da equipe em direção à conclusão do trabalho comprometido no backlog do sprint.
O Scrum Agile Burndown Chart é uma representação visual usada no gerenciamento de projetos Agile para rastrear o progresso do trabalho concluído em um sprint. Ele exibe a quantidade de trabalho restante a ser feito ao longo do tempo, normalmente na forma de um gráfico de linhas.
O eixo horizontal representa o tempo, geralmente em dias ou semanas, enquanto o eixo vertical representa a quantidade de trabalho restante, geralmente medida em pontos de história ou tarefas. Conforme a equipe conclui tarefas ou histórias de usuário, a linha no gráfico se move para baixo, indicando o progresso.
O objetivo do Burndown Chart é ajudar a equipe a visualizar seu progresso em direção à conclusão das metas do sprint e identificar quaisquer desvios da trajetória planejada. Ele fornece insights valiosos sobre a velocidade da equipe e permite que ajustes sejam feitos, se necessário, para garantir o sucesso do sprint.
Um gráfico de burndown do Scrum é uma ferramenta visual usada no gerenciamento ágil de projetos para rastrear o progresso do trabalho concluído em um sprint. Ele exibe o esforço restante (geralmente medido em pontos de história ou horas) ao longo do tempo, normalmente diariamente. O eixo vertical representa a quantidade de trabalho restante, enquanto o eixo horizontal representa o tempo, geralmente em dias ou sprints.
No Scrum, as atividades de gerenciamento de risco são divididas entre várias funções, com alguma responsabilidade recaindo sobre todos na Equipe Scrum e o Scrum Master facilitando o processo. O gerenciamento de risco é essencial para garantir a criação de valor; portanto, as atividades de gerenciamento de risco são realizadas durante todo o ciclo de vida do projeto e não apenas durante o início do projeto.
Cada risco pode ser avaliado usando diferentes ferramentas de Avaliação de Risco. No entanto, a ferramenta preferida para avaliar riscos para criar um Gráfico de Burndown de Risco é o Valor Monetário Esperado (EMV).
As informações coletadas durante a avaliação de risco podem ser usadas para criar um Gráfico de Burndown de Risco. Isso descreve a gravidade cumulativa do risco do projeto ao longo do tempo. As probabilidades dos vários Riscos são plotadas umas sobre as outras para mostrar o risco cumulativo no eixo y. A identificação e avaliação inicial dos riscos no projeto e a criação do Risk Burndown Chart são feitas inicialmente. Então, em intervalos de tempo predeterminados, novos riscos podem ser identificados e avaliados e os riscos restantes devem ser reavaliados e atualizados de acordo no gráfico. Um momento apropriado para fazer isso é durante a Reunião de Planejamento do Sprint. Rastrear riscos dessa maneira permite que a equipe reconheça tendências na exposição ao risco e tome as medidas apropriadas, conforme necessário.